Real-scale 3D simulator

Flat Earth or globe: what do you really see from up there?

This project compares two models of the Earth, with the same data: the spherical Earth (the globe) and the flat Earth described by the Flat Earth Society. On both, the simulator places a hot-air balloon and lets you rise up to 100 000 m (328 084 ft). Horizon, curvature, distant mountains and the ice wall are computed at real scale: nothing is adjusted by hand.

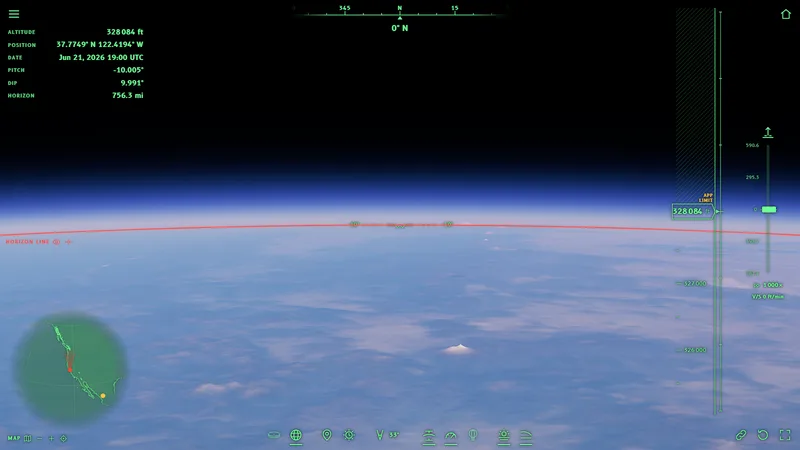
View from 100 km above San Francisco, looking north: Globe
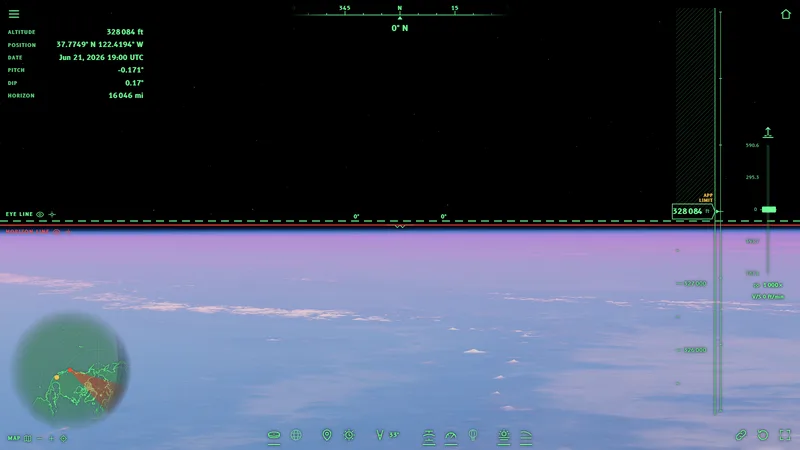
View from 100 km above San Francisco, looking north: Flat Earth
The two images have the same altitude (100 000 m | 328 084 ft above San Francisco), the same direction (north) and the same time. The globe is on the left and the flat Earth on the right: drag the vertical line with the circle in the middle to the right to see more globe, to the left to see more flat Earth. You can also tap “Globe” or “Flat Earth” to see one of them whole.
  1. Two models

    The simulator uses the globe as geodesy measures it (the WGS84 ellipsoid) and the disc as the Flat Earth Society describes it, with the North Pole at the center and Antarctica as a ring of ice around the edge.

  2. The same data

    The two models have the same mountains, the same coasts, the same air and the same Sun. Only the shape of the Earth changes: every difference you see comes from there.

  3. Nothing put in by hand

    No result is written into the program. For every pixel the simulator computes what the eye sees; horizon and distances are measured on the image, as you would do with a protractor.

This project is meant for the discussion between those who support the flat Earth and those who support the globe. Flat-Earthers and globe supporters see the same scene, with the same numbers: those who follow flat Earth theory find their model here without caricature, with its sources, the Flat Earth Society and Rowbotham's zetetic astronomy. Look at the stops in the two models, compare what they show with what you really see, in the photos cited or with your own eyes, and decide for yourself which model matches reality.

Around the world in a hot-air balloon

Eight stops: first we look farther and farther, from the seashore to a mountain 443 km (275 mi) away; then we rise higher and higher, from the summit of Everest to 39 km (24 mi) of altitude; at the end we go looking for the edge of the world. In the first part we look at distant mountains that someone has really seen or photographed. Every stop has the view on the globe and the view on the flat Earth: drag the line to compare them, then open the stop in the simulator and move around on your own. The images have the natural field of view of a screen 1 600 pixels wide (33°), except where the zoom is stated: the question on the field of view explains why it is narrower than that of the eyes.

In the images the dashed green line is the eye line, the exact horizontal at the height of your eyes; the red line is the sea horizon.

Stop 1 · Europe, Ostia

From here the Earth looks flat. Is it?

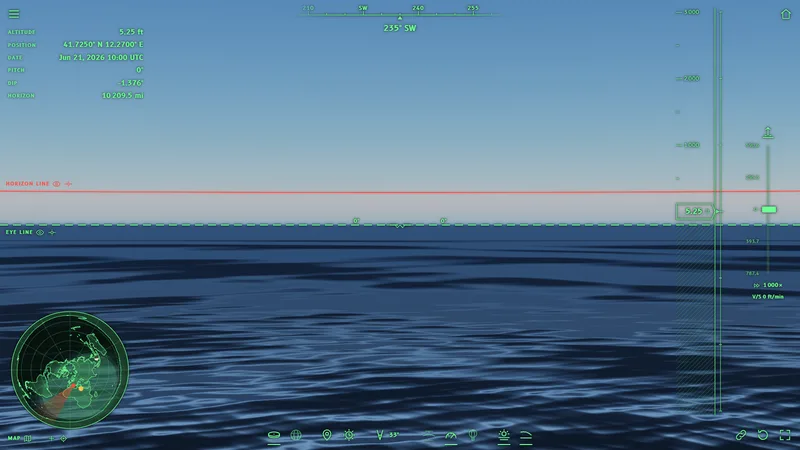
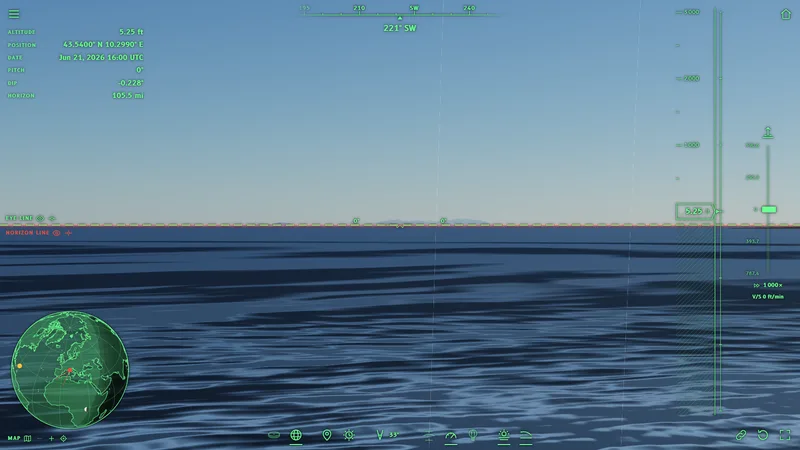
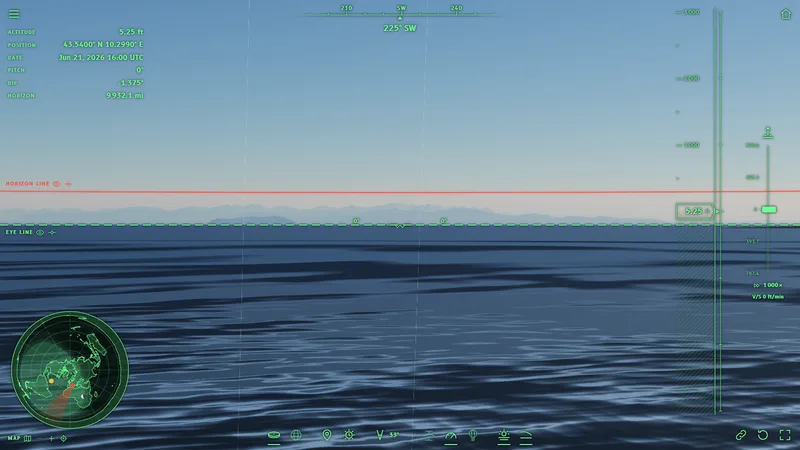
The journey starts from Ostia, on the seashore, with the eyes 1.6 m (5.2 ft) above the water. Ahead lies the open sea, to the southwest.
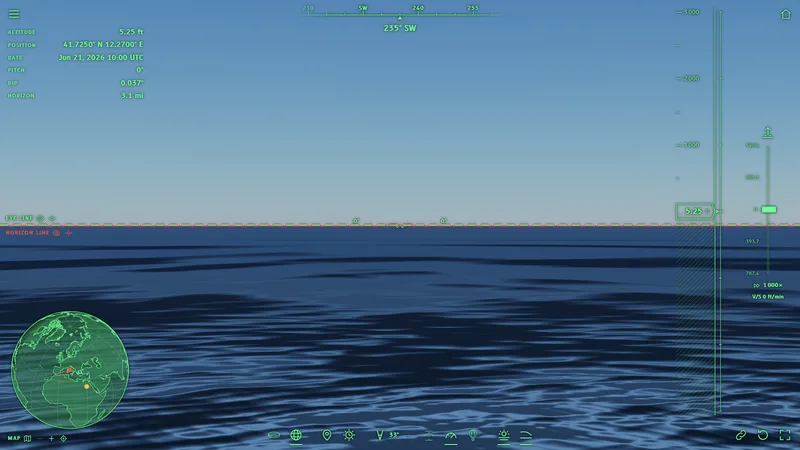
From here the Earth looks flat. Is it?: Globe
From here the Earth looks flat. Is it?: Flat Earth
GlobeZoom
From here the Earth looks flat. Is it?: Globe
1×
Simulator
Flat EarthZoom
From here the Earth looks flat. Is it?: Flat Earth
1×
Simulator

What to look for

On the globe
  • The sea horizon is just below the eye line: 0.037°. This dip is so small that the dashed green line (the eye) and the red line (the horizon) almost touch.
  • The sea is visible up to about 5 km (3.1 mi): farther away the surface drops out of sight.
On the flat Earth
  • With the atmosphere the horizon appears a little above the eye line: 1.4°. The question on the flat Earth horizon explains why.
  • Between the eye line and the horizon line there is a light band: it is the very distant sea, seen through thousands of kilometers of air.

In brief: From here, on the seashore, the naked eye cannot tell which model is right: we need to look farther.

If from here you cannot tell which model is right, let us look at something beyond the horizon: an island 170 km (106 mi) away.
Stop 2 · Europe, Livorno

What is behind the horizon?

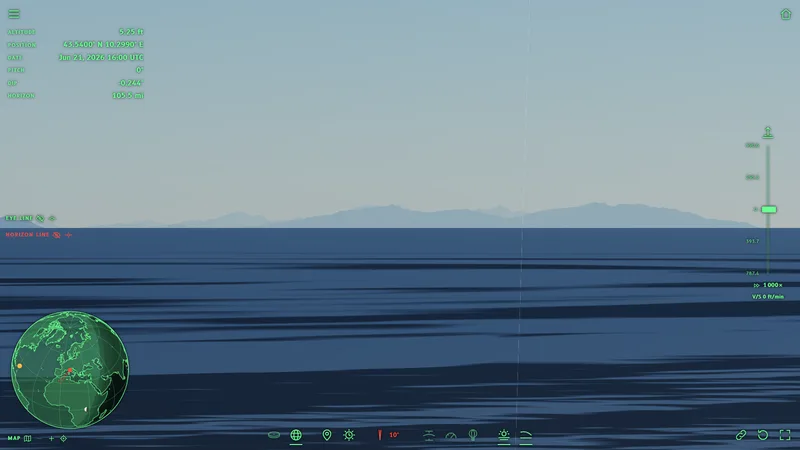
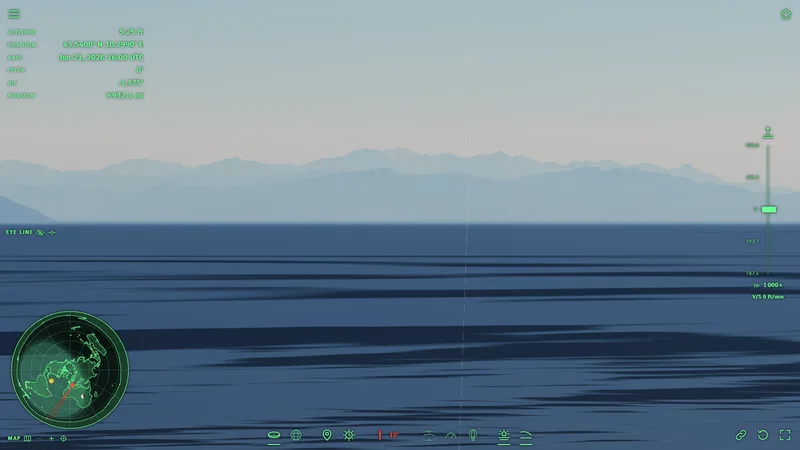
From the shore of Livorno, on clear days, the mountains of Corsica are visible. Monte Cinto, the highest peak (2 706 m | 8 878 ft), is 169.8 km (106 mi) away.

With the naked eye (natural field of view, 33°)
What is behind the horizon?: GlobeMonte Cinto
What is behind the horizon?: Flat EarthMonte Cinto
GlobeZoom
What is behind the horizon?: GlobeMonte Cinto
1×
Simulator
Flat EarthZoom
What is behind the horizon?: Flat EarthMonte Cinto
1×
Simulator
With the zoom (field of view of 10°), like a Nikon P900
What is behind the horizon?: GlobeMonte Cinto
What is behind the horizon?: Flat EarthMonte Cinto
GlobeZoom
What is behind the horizon?: GlobeMonte Cinto
1×
Simulator
Flat EarthZoom
What is behind the horizon?: Flat EarthMonte Cinto
1×
Simulator

What to look for

On the globe
  • Between Livorno and Corsica the sea surface follows the curve of the Earth and forms a bulge: it hides the lowest 1 780 m (5 840 ft) of Monte Cinto. The peaks remain, just showing above the sea.
  • With the natural field of view (33°) the peaks are small. With the zoom at 10° the difference is clear: the whole lower part of the island is missing.
  • The zoom magnifies, but it does not bring back above the sea what lies behind the curve: see the question on the zoom.
On the flat Earth
  • Corsica would be visible whole, from the beach to the peaks, only smaller because of the distance (178.8 km | 111 mi on the disc map).

In brief: On the globe only the peaks of Corsica remain, on the flat Earth the whole island would be visible: with the zoom the difference is obvious.

From Livorno, on the clearest days, photographers even capture Monviso, 296 km (184 mi) away: the photo by Fabio Longaron.

Only the peaks of Corsica remain. What if the mountain is much higher? Let us go to Alaska.

Stop 3 · North America, Alaska

Can you see a mountain 214 km (133 mi) away from a city?

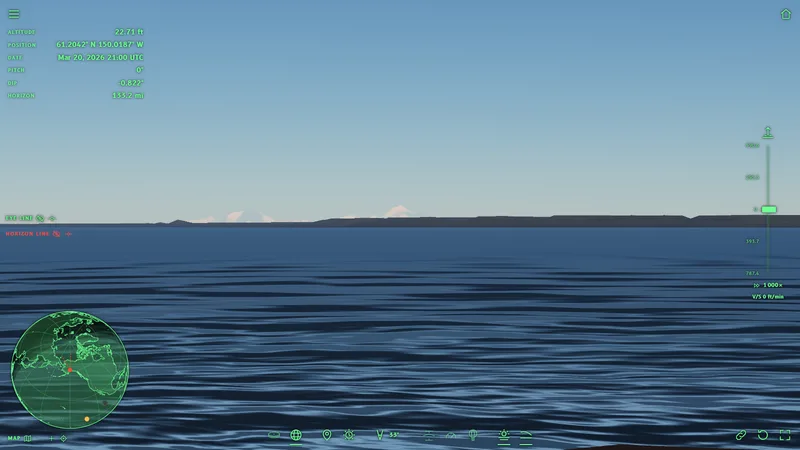
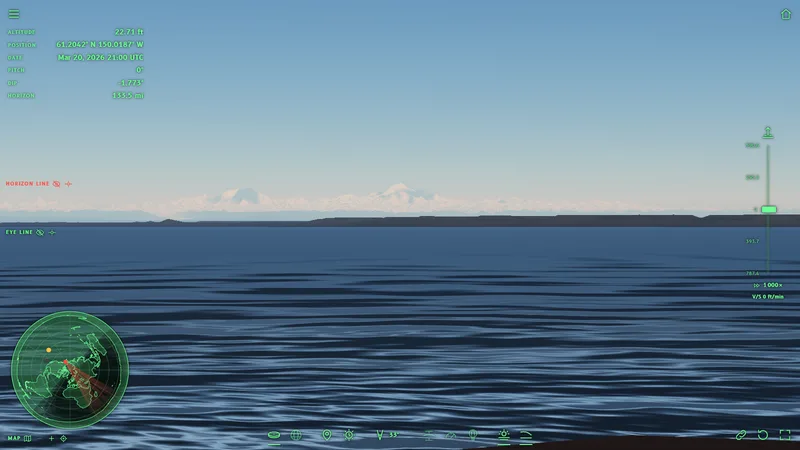
From Point Woronzof, in Anchorage, by the sea, Denali (6 190 m | 20 308 ft), the highest mountain in North America, is visible on clear days, 214.1 km (133 mi) away.

Can you see a mountain 214 km away from a city?: GlobeDenali
Can you see a mountain 214 km away from a city?: Flat EarthDenali
GlobeZoom
Can you see a mountain 214 km away from a city?: GlobeDenali
1×
Simulator
Flat EarthZoom
Can you see a mountain 214 km away from a city?: Flat EarthDenali
1×
Simulator

What to look for

On the globe
  • Denali is visible, but the curvature hides its lowest 2 730 m (8 957 ft): the snowy peaks rise above the sea and the hills.
On the flat Earth
  • The whole Alaska Range would be visible, down to the foot of the mountains.

In brief: Local guides say that Denali is visible from Anchorage “on clear days”, and they point out its peaks: exactly the part that stays above the curve.

The places from which Denali is visible: Alaska.org.

Of Denali too, only the upper part is visible. To see farther you have to start from high up: from the Pyrenees, at 2 826 m (9 272 ft), a photo reached the Alps, about 443 km (275 mi) away.

Stop 4 · Europe, Pyrenees

Can you photograph a mountain 443 km (275 mi) away?

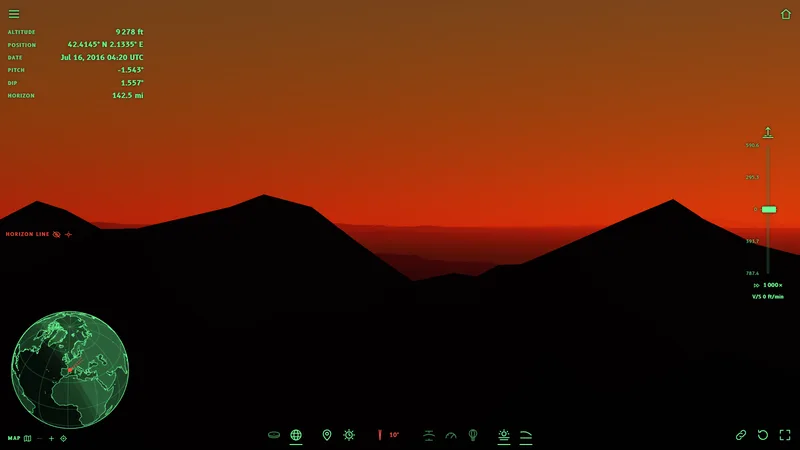
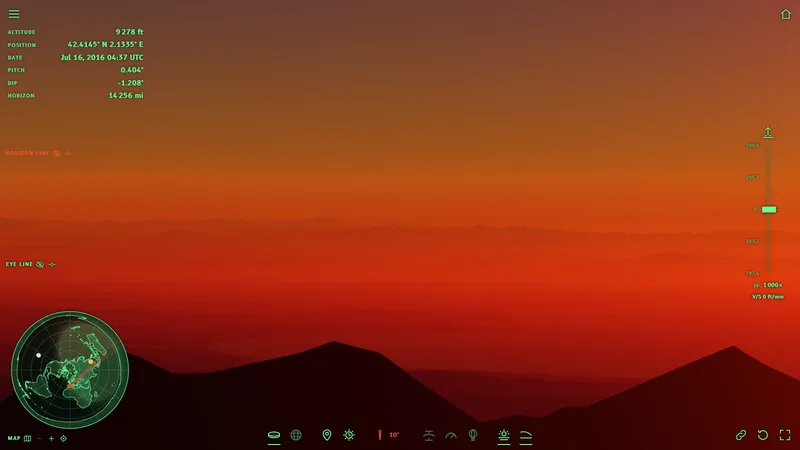
On 16 July 2016, at dawn, Marc Bret photographed Pic Gaspard, in the French Alps, about 443 km (275 mi) away, from Pic de Finestrelles (2 826 m | 9 272 ft). For years it was the farthest landscape photo ever taken.

Can you photograph a mountain 443 km away?: GlobePic Gaspard, behind the horizon
Can you photograph a mountain 443 km away?: Flat EarthPic Gaspard
GlobeZoom
Can you photograph a mountain 443 km away?: GlobePic Gaspard, behind the horizon
1×
Simulator
Flat EarthZoom
Can you photograph a mountain 443 km away?: Flat EarthPic Gaspard
1×
Simulator

What to look for

On the globe
  • With the air of an ordinary morning the curvature hides 3 680 m (12 073 ft), almost all of Pic Gaspard (3 883 m | 12 740 ft). Even with the zoom at 10° the Alps do not appear: the line of sight touches the ground at 229.3 km (142 mi), much closer.
  • Photos like this one succeed only on a few days, at dawn or at sunset, when the cold air near the ground bends light more than usual and the distant mountains appear dark against the bright sky.
On the flat Earth
  • The Alps would be visible whole every clear morning, as in the image.
  • This image was taken 17 minutes after the globe one: at the same time it would still be almost dark here, because the air raises the horizon and the Sun rises later. See the question on the sunset.

In brief: On the globe the Alps are visible from here only on the rare days with the right air, on the flat Earth they would be visible every clear morning.

The photo and its story: Pic Gaspard.

So far we have looked far away. Now we rise: first to the highest peak in the world.

Stop 5 · Asia, Nepal

From the summit of Everest, is the horizon still at eye level?

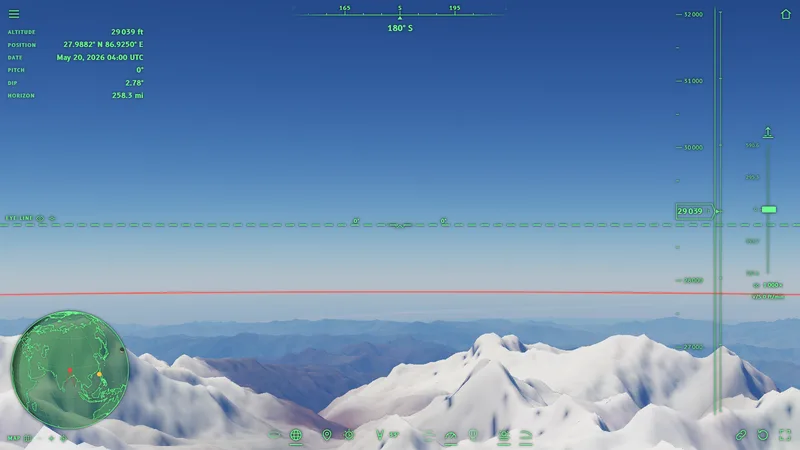
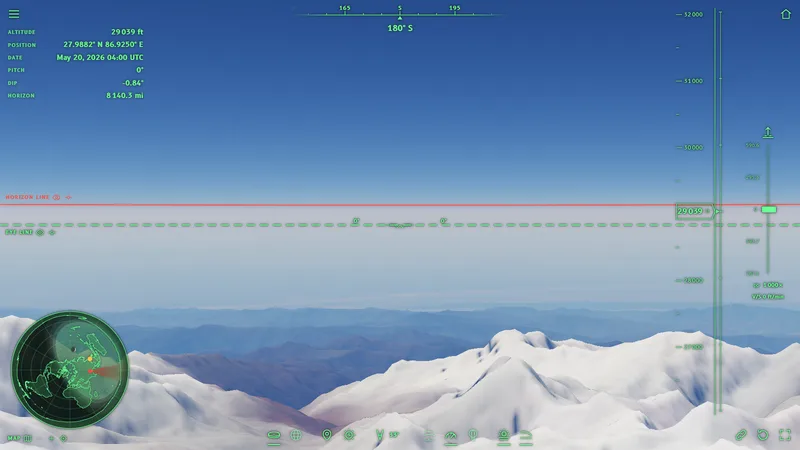
We are on the summit of Everest, at 8 849 m (29 032 ft), looking south, toward the plains of India.

From the summit of Everest, is the horizon still at eye level?: Globe
From the summit of Everest, is the horizon still at eye level?: Flat Earth
GlobeZoom
From the summit of Everest, is the horizon still at eye level?: Globe
1×
Simulator
Flat EarthZoom
From the summit of Everest, is the horizon still at eye level?: Flat Earth
1×
Simulator

What to look for

On the globe
  • The horizon is 2.78° below the eye line: more than five times the width of the full Moon in the sky.
  • The horizon is 415.6 km (258 mi) away.
On the flat Earth
  • The horizon would stay above the eye line, even from up here: 0.84° above.

In brief: With the naked eye this is hard to notice, because there is nothing horizontal to compare the horizon with. With a spirit level, or with the eye line of the simulator, you can measure it.

On Everest the surrounding mountains cover part of the horizon. Let us rise again, to 10 000 m (32 808 ft) above the Pacific, where there is only sea all around.

Stop 6 · North Pacific

Why can't you see the curve from an airplane window?

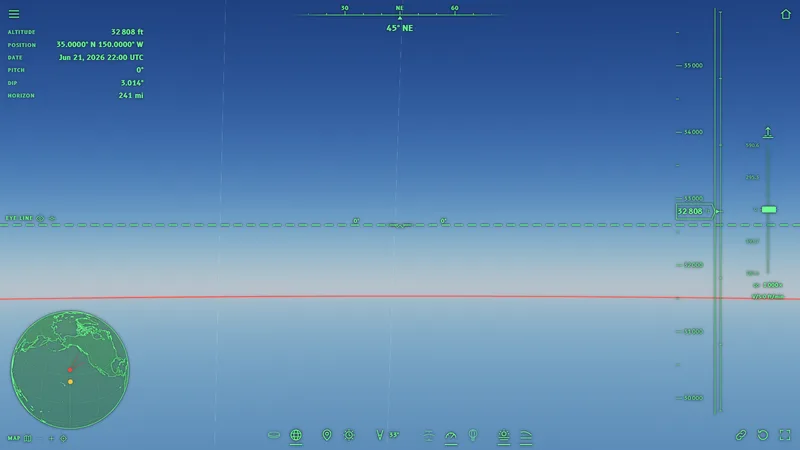
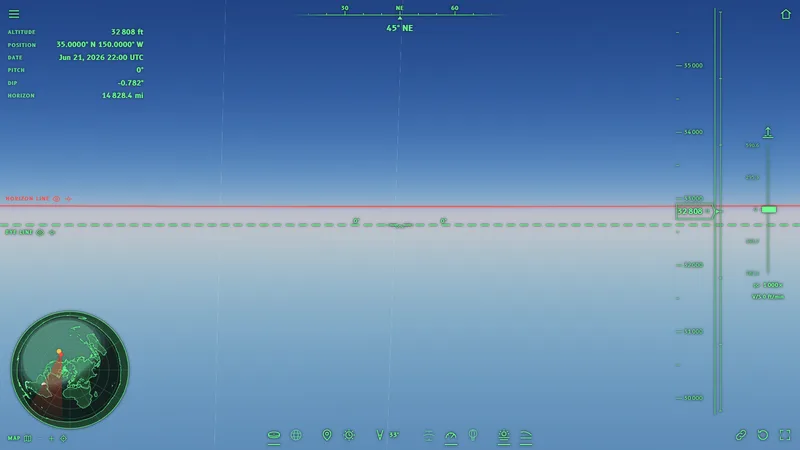
We are at 10 000 m (32 808 ft), the altitude of an airliner, in the middle of the Pacific: there is only sea all around, in every direction.

Why can't you see the curve from an airplane window?: Globe
Why can't you see the curve from an airplane window?: Flat Earth
GlobeZoom
Why can't you see the curve from an airplane window?: Globe
1×
Simulator
Flat EarthZoom
Why can't you see the curve from an airplane window?: Flat Earth
1×
Simulator

What to look for

On the globe
  • The horizon is 3.014° below the eye line and 387.8 km (241 mi) away.
  • The curve is there, but in a stretch of horizon as wide as a window it is tiny. Seeing it takes a wide field of view and a clean horizon, without clouds: see the question on the airplane.
On the flat Earth
  • The horizon would be a straight line, above the eye line (0.782° above).

In brief: From the window the curve of the globe is too small to decide by eye: the difference shows when you measure the horizon against the eye line, below on the globe and above on the flat Earth.

An airplane flies at 10 km (6.2 mi). Felix Baumgartner rose almost four times higher, up to 38 969 m (127 851 ft), above the New Mexico desert.

Stop 7 · North America, New Mexico

Is the curve visible from 39 km (24 mi)?

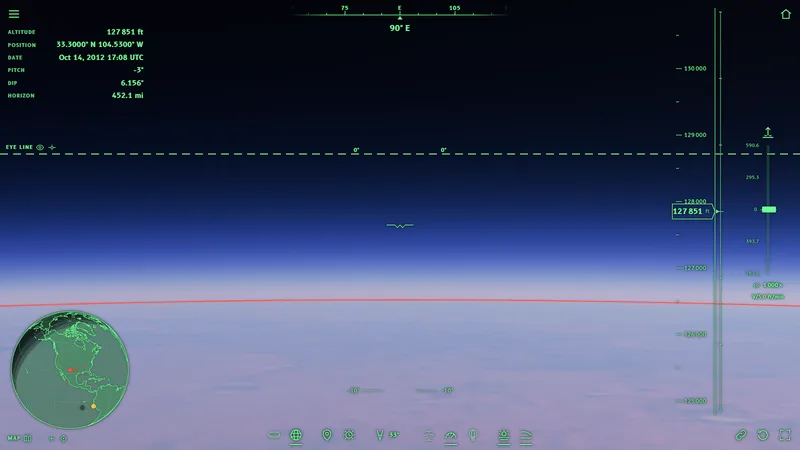
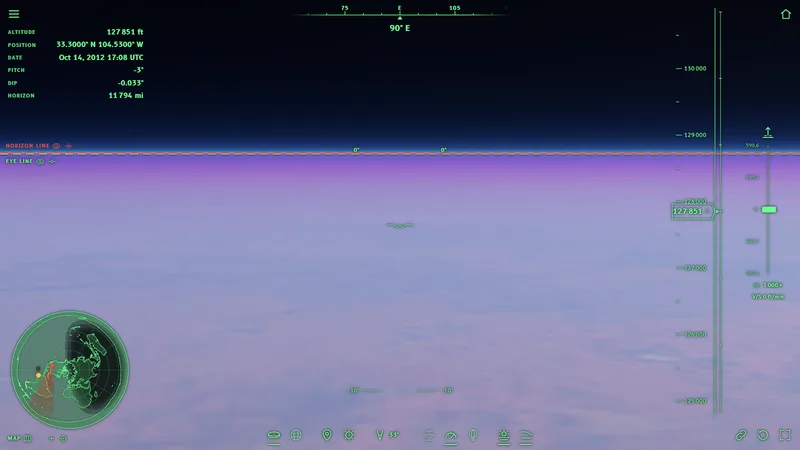
On 14 October 2012 Felix Baumgartner jumped from 38 969 m (127 851 ft) above Roswell. We are at the same altitude, with the natural field of view of the screen (33°).

Is the curve visible from 39 km?: Globe
Is the curve visible from 39 km?: Flat Earth
GlobeZoom
Is the curve visible from 39 km?: Globe
1×
Simulator
Flat EarthZoom
Is the curve visible from 39 km?: Flat Earth
1×
Simulator

What to look for

On the globe
  • The horizon is 6.156° below the eye line, 727.6 km (452 mi) away. It also looks curved: at the edges of the image it is lower than at the center.
On the flat Earth
  • The horizon is a straight line, practically on the eye line (0.033° above).

In brief: The footage of the jump used wide-angle lenses, which bend straight lines. The simulator uses a projection without distortion: the curve you see here does not come from the lens. See the question on the lens.

The jump: Red Bull Stratos.

We have looked far away and risen high. One last question remains: does the world have an edge?

Stop 8 · Antarctica, Ross Ice Shelf

Does the ice wall exist?

Yes: the wall is the front of the Ross Ice Shelf, a wall of ice tens of meters high and hundreds of kilometers long. We are at sea, in front of the wall.

Does the ice wall exist?: Globe
Does the ice wall exist?: Flat Earth
GlobeZoom
Does the ice wall exist?: Globe
1×
Simulator
Flat EarthZoom
Does the ice wall exist?: Flat Earth
1×
Simulator

What to look for

On the globe
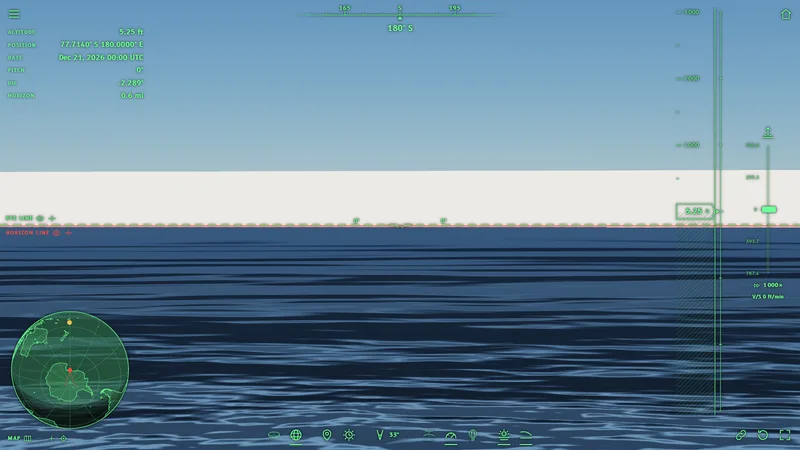
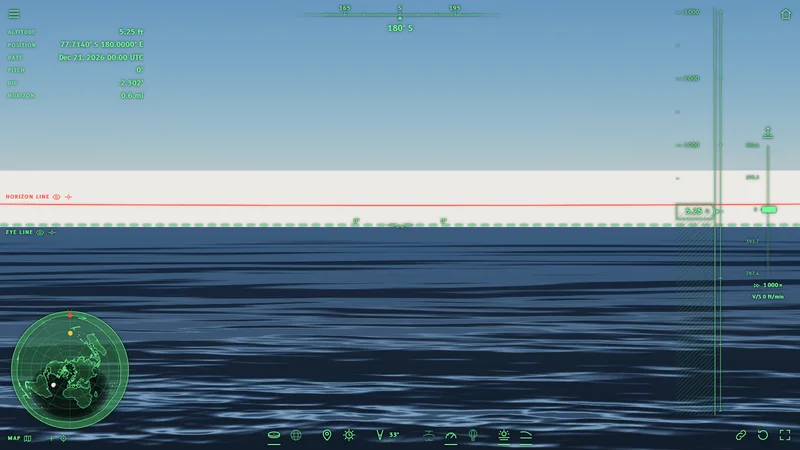
  • The ice wall is the one in the data: compared with the disc the difference here is almost zero (0.013°).
  • The Antarctic coast is 56 691 km (35 226 mi) long.
On the flat Earth
  • The wall is the same as on the globe: same data, same height.
  • The Antarctic coast is 310 554 km (192 969 mi) long, that is 5.5 times longer, because on the disc Antarctica becomes a ring around all the land.

In brief: No explorer has found a wall surrounding the world: Antarctica has been crossed and flown over, and at the South Pole there is a scientific station inhabited all year round. See the question on the Antarctic Treaty.

The Ross Ice Shelf: Britannica; Byrd and the “ice wall”: Logically Facts.

Frequently asked questions about the flat Earth

Here are the questions most often asked about the flat Earth and the globe, the “ball Earth” of flat-Earthers, with the answers of the simulator and the sources.

Evidence and measurements

Is there any evidence that the Earth is flat or that it is a sphere?

A piece of evidence is an observation that one model predicts and the other does not. The simulator is built to find them: it puts the two models side by side, with the same data, and shows where they give different images.

  1. Up close the two models look alike: on the seashore the difference is minimal (stop 1).
  2. From afar the two models part ways: on the globe distant mountains lose their lower part, on the flat Earth they would be visible whole (Corsica, Denali).
  3. From high up the horizon of the globe drops below the eye and curves; the horizon of the flat Earth does not (Everest, 39 km | 24 mi).

Anyone can compare these images with what is really visible, in the photos cited in each stop or with their own eyes.

Is the flat horizon evidence of a flat Earth?

No, because on the globe the horizon looks flat almost always.

  1. From the ground we see a tiny piece of the Earth: from the shore the sea is visible up to about 5 km (3.1 mi), while the circumference of the Earth is 40 000 km (24 855 mi).
  2. If the Earth were shrunk a million times, it would be a ball 12.8 m (42 ft) across, and the piece of sea seen from the shore would be 1 cm (0.39 in) wide: on a ball that big such a short stretch looks straight.
  3. The curve of the horizon starts to show only very high up and with a wide view (see the question on the curvature).

So a horizon that looks flat does not tell the two models apart. Distant mountains and the dip of the horizon from high up tell them apart.

Do ships disappear over the horizon because of perspective or because of curvature?

Perspective makes distant things smaller, but it does not cut them off from the bottom. A distant ship on a plane would become smaller and smaller, but it would stay whole.

On the globe, instead, a ship sailing away disappears from the bottom: first the hull, then the decks, finally the tops of the masts. This is the same effect as the distant mountains of the stops: Corsica from Livorno shows only the peaks.

The zoom does not bring the hull back: it magnifies the image, but it does not change what lies behind the curve (see the question on the zoom).

How do you calculate the curvature of the Earth? The curvature calculator

On a sphere of radius R, with the eyes at a height h above the sea, without atmosphere:

  • the horizon is at a distance of about the square root of 2 × R × h;
  • the horizon is below the eye line by an angle that grows with altitude;
  • of an object at distance d, beyond the horizon, a height of about (d minus the horizon distance) squared, divided by 2 × R, stays hidden.

The table below gives the values without atmosphere. With the atmosphere light bends a little downward and you see a little farther: the simulator computes this with the standard atmosphere. With refraction off, from 1.6 m (5.2 ft) the simulator measures 0.041° on the sea, and the formula gives 0.041°: the same value.

Horizon of a sphere of radius 6 378.1 km (3 963 mi), without atmosphere
Eye altitudeHorizon distanceDip
1.6 m5.2 ft4.5 km2.8 mi0.041°
400 m1 312 ft71.4 km44.4 mi0.642°
3 000 m9 843 ft195.6 km122 mi1.757°
10 000 m32 808 ft357.2 km222 mi3.206°
38 969 m127 851 ft705.1 km438 mi6.318°

Did the experiments to measure the curvature fail? The Bedford Level

In 1838 Samuel Rowbotham watched a boat along a straight canal in England, the Bedford Level, with his telescope 8 inches (20.3 cm) above the water, and wrote that he saw it for 9.7 km (6 mi) without it disappearing (Rowbotham). On a sphere, without atmosphere, about 5.1 m (17 ft) would be hidden at that distance.

Repeating the test in 1870 with poles at the same height, Alfred Russel Wallace found the curvature instead. On a canal like that, a few centimeters above the water, the air near the surface bends light a lot and the result changes with the weather and the temperature: this is why similar measurements give different results (Bedford Level).

The simulator cannot reproduce this experiment: the canal is about thirty meters wide, less than the smallest cell of the terrain. The same holds for the laser experiments on lakes: the simulator draws mountains, sea and sky, not beams of light.

Why does the journey leave out Chicago, Toronto and the Lake Pontchartrain power lines?

Chicago, Toronto and Lake Pontchartrain are often cited cases: the Chicago skyline seen from Michigan, the Toronto skyline seen across Lake Ontario, the power lines that cross Lake Pontchartrain in Louisiana.

The simulator, however, draws only the terrain, the sea, the ice and the sky, not buildings or power lines. Showing these cases would mean inventing objects that are not in the data: this is why the journey uses only mountains and coasts, which are in the terrain measured by satellites.

What is zetetic astronomy?

Zetetic astronomy is the method proposed by Samuel Rowbotham in 1865: start only from what is observed directly, without theories. The flat Earth model of the Flat Earth Society comes from this method.

The simulator follows the same idea: no results written by hand, only what an eye would see in the two models, measured on the image. The disc is the one described by Rowbotham and by the Flat Earth Society; the globe is the one of geodesy.

Does the simulator use NASA photos?

No: the simulator uses no photos at all. The images are computed pixel by pixel from the data: mountains measured by satellites (Copernicus, NOAA), coasts, measured ground colors (MODIS albedo), air and sunlight. All the sources are in Data and sources.

This way the image does not depend on a photo that someone might consider retouched: it depends on public numbers, which anyone can check one by one.

How is gravity explained on the flat Earth?

The Flat Earth Society proposes “universal acceleration”: the disc would rise continuously, pushing everything upward (Universal Acceleration).

With a push equal everywhere, however, weight should be identical at every point. The measurements say otherwise: gravity is 9.7803 m/s² at the equator and 9.8322 m/s² at the poles, that is 0.5% more (WGS84). The flattened, rotating globe predicts exactly this difference.

The simulator does not use gravity to draw: it cites it only as a comparison.

Curvature and horizon

At what altitude can you see the curvature of the Earth?

The altitude depends on how wide the view is, that is on the field of view. The most cited study (Lynch, Applied Optics, 2008) says:

  • with a wide view, 90° or more, the curvature starts to show from about 10 700 m (35 000 feet);
  • with a narrow view, under 60°, it does not show at that altitude;
  • pilots describe it as evident from about 15 000 m (49 213 ft) and obvious from about 18 000 m (59 055 ft).

The Flat Earth Society also writes that on the globe about 18 300 m (60 000 feet) would be needed.

In the simulator, at 10 000 m (32 808 ft) and with the natural field of view, the curve is barely visible (Pacific); at 39 km (24 mi) it is clearly visible (Roswell).

Why does the horizon always seem to be at eye level?

  1. On the globe the horizon drops below the eyes as you rise, but only a little: 0.037° from the shore, 3.014° from an airplane, 2.78° from Everest.
  2. These are small angles. Two and a half degrees is as much as five full Moons side by side: without a horizontal reference nearby, the eye does not notice it.
  3. With a spirit level, or with the eye line of the simulator (the dashed green line), you can see instead that the horizon is below.

On the flat Earth, with the atmosphere, the horizon would be a little above the eyes at every altitude (see the question on the flat Earth below).

Why can't I see the curvature from an airplane or from a mountain?

Because the window shows a stretch of horizon that is too narrow. At 10 000 m (32 808 ft) the curve is there (Pacific), but over a stretch a few degrees wide the difference between the center and the edges is minimal.

The same holds from a mountain, and the surrounding terrain also covers the horizon. What you can notice, if you know where to look, is that the horizon is below the eyes (Everest).

Does the “8 inches per mile squared” calculation work?

The rule says how far the sea drops below a straight line tangent to the Earth: 8 inches (20.3 cm) times the miles squared. At 100 km (62.1 mi) it gives 785 m (2 575 ft).

But the rule does not say what you see, because it counts as if the eyes were at water level. With the eyes at 1.6 m (5.2 ft) the horizon is already at 4.5 km (2.8 mi): the hidden part is calculated only beyond that point, and at 100 km (62.1 mi) the hidden part is 715 m (2 346 ft), not 785 m (2 575 ft).

Those who use the rule without the height of the eyes find a number that is too large, and then a mountain that “should” be hidden turns out to be visible. The simulator takes into account the altitude of the eyes, the true shape of the Earth and the air.

Islands, lighthouses and distant mountains: is the curvature “missing”?

The stops of the journey answer with real cases. Where the observer is low, only the upper part of the distant target is visible (Corsica, Denali).

Record photos beyond 250 km (155 mi), like the one of Pic Gaspard, succeed only rarely and show only the peaks: on the flat Earth those mountains would be visible whole on every clear day.

Isn't water always level?

Still water is level over short distances: in a glass, in a lake, the curvature is too small to see. Over 1 km (0.62 mi) the sea surface drops 8 cm (3.1 in) below a straight line.

Water follows the direction of gravity, which on the globe always points toward the center: over large distances the sea surface curves together with the Earth. This is what the sea stops show (Corsica, Denali).

Air and refraction

Is refraction an excuse?

Refraction is light bending as it crosses air of different density: it is measured, and surveyors and navigators use it every day.

The simulator computes it from the 1976 standard atmosphere (U.S. Standard Atmosphere) and from the air index of Ciddor, the same in the two models. The refraction button (J key) turns it off, so you can see what changes.

On ordinary days refraction lets you see a little farther, but not enough to cancel the curvature: the distant mountains of the stops stay cut off at the bottom. The exceptional days, with cold air near the ground, are rare: this is why records beyond 250 km (155 mi) are rare (Pic Gaspard).

Isn't it the haze that hides distant mountains?

Haze fades distant mountains, but it does not cut them off from the bottom: it makes them lighter all in the same way, from the base to the summit.

In the simulator the air is that of a very clear day: there are fewer suspended particles than those measured on the cleanest days at Mauna Loa, one of the places with the clearest air in the world. At sea level the eye sees up to about 236 km (147 mi), and with perfectly clean air up to 322 km (200 mi).

Beyond 300-400 km (186-249 mi) even the cleanest air lets very little light through: this is why record photos are taken at dawn or at sunset, with the mountain dark against the bright sky.

Why is the horizon above the eye line on the flat Earth?

  1. On a plane without atmosphere the farthest point you see is extremely far away: you see it practically at the height of your eyes.
  2. With the atmosphere light bends downward. A ray that leaves your eye slightly upward bends and falls back onto the distant plane.
  3. The ray of light behaves like a stone thrown far: to make it go far you have to throw it slightly upward. So you see the distant plane a little above the horizontal.
  4. This is why from Ostia, on the flat Earth, the horizon is 1.4° above the eye. With refraction off, it goes back almost onto the eye line.

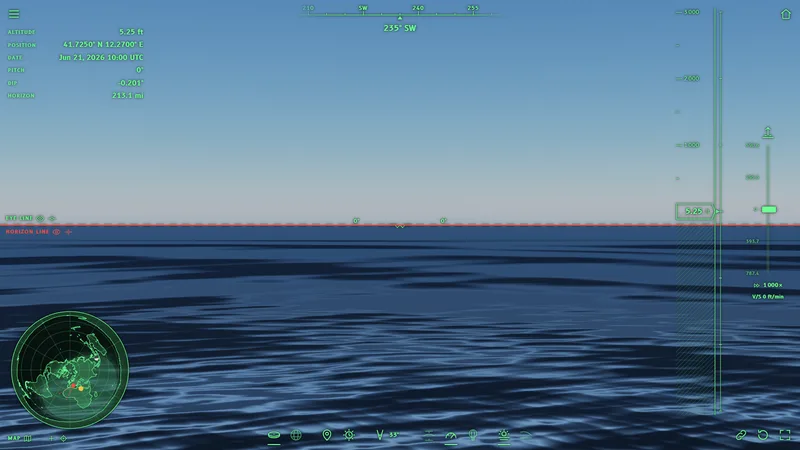
Without refraction, at the center of the image the instrument measures the mountains of Sardinia, at 343 km (213 mi), 0.201° above the eye: on the flat Earth they would stand above the sea, but the haze hides them.

On the globe refraction lets you see a little farther, but the horizon stays below the eye line.

With refraction: Flat Earth
Without refraction: Flat Earth

Photos, zoom and instruments

Why do I see less in the simulator than with my own eyes? The field of view

With both eyes we see about 214° horizontally, counting side vision; we see details, however, only in the central 60° or so (Strasburger and others, 2011, corrected in 2024).

The screen is like a window: it shows only the part of the world that lies behind it. The simulator opens with the “natural” field of view of your window, that is the angle the screen really covers in front of your eyes, at about 71 cm (28 in) away (the reference pixel of the W3C), never below 20°.

You change the field with the mouse wheel, with two fingers or with the “Field of view” control, from 10° to 120°; the F key goes back to the natural one. The wider the field, the smaller and farther things look, as in a wide-angle photo.

Is the curve in photos caused by the lens?

Many lenses, like those of action cameras, bend straight lines: a straight horizon can look curved, and a curved one can look straight or bent the other way, depending on where it sits in the frame.

The simulator uses a projection without distortion, like a perfect lens: straight lines stay straight. If the horizon of the globe looks curved, as at 39 km (24 mi) in the Roswell stop, the curve belongs to the Earth, not to the lens. On the flat Earth, at the same altitude, the horizon stays straight.

Why is the red line a little higher at the sides on the flat Earth?

  1. On the flat Earth, with the atmosphere, the horizon appears a little higher than the eye, about 1.4°, in every direction.
  2. A photo, or the screen, is like a flat sheet held in front of the eye. The center of the sheet is close to the eye, the edges a little farther.
  3. Something that is 1.4° above the eye must be drawn on the sheet the higher, the farther the sheet is: like a tilted laser beam, the farther away you stop it, the higher it reaches.
  4. This is why at the edges of the photo the horizon comes out a little higher than at the center. The horizon does not really rise: the flat sheet draws it that way.

On the globe the opposite happens: the horizon is below the eye, so at the edges of the photo it comes out a little lower.

Does a zoom, for example that of the Nikon P900, bring back into view what is hidden?

The zoom magnifies what reaches the eye, but it does not change the path of light. If the lower part of a mountain lies behind the curve of the sea, no ray of light arrives from there, and no zoom can show it.

The zoom instead shows small things better if they were already above the horizon, for example the distant peaks. The Corsica stop has the same view with the naked eye and with the zoom: with the zoom the peaks are clearer, but the lower part of the island does not come back.

How can I check that the simulator is not rigged?

  • all the values used are in Data and sources, each with its public source;
  • no result is written into the program: horizon, distances and altitudes are read on the computed image;
  • the two models use the same data and the same optics: you can switch from one to the other at the same point and compare;
  • every stop opens in the simulator exactly as in the image, and from there you can go wherever you want: with a double click on the scene or on the map you choose a point and go there;
  • you can compare the images with the real photos cited in the stops, or with what you see yourself.

Antarctica

Does the Antarctic ice wall exist?

Walls of ice do exist on the coast of Antarctica: they are the fronts of the ice shelves, like the Ross Ice Shelf, tens of meters high (last stop). According to the Flat Earth Society (Ice Wall) the wall is 45.72 m (150 ft) high.

In the simulator the wall is as high as the data say, in the two models. What changes is the length of the wall: the Antarctic coast is 56 691 km (35 226 mi) on the globe and 310 554 km (192 969 mi) on the disc, where it surrounds all the land.

Behind the walls the ice continues for thousands of kilometers to the South Pole, where there is a scientific station inhabited all year round: Antarctica has been crossed on foot, by sledge and by airplane.

What did Admiral Byrd find in Antarctica? Operation Highjump

Richard Byrd flew over the South Pole on 28 November 1929, in a Ford Trimotor airplane: the round trip took 18 hours and 41 minutes (Richard E. Byrd).

Operation Highjump, in 1946-1947, was a United States Navy expedition organized by Byrd: about 4 700 men, 13 ships and 33 aircraft, to build the Little America IV base and photograph coasts and ice from the air (Operation Highjump).

Byrd's words about a land “beyond the Pole” are cited as evidence of lands beyond an ice wall. The expeditions found the coasts, mountains and ice of Antarctica, not a wall around the world (Logically Facts).

Does the Antarctic Treaty forbid going to Antarctica or flying over the South Pole?

No. The Antarctic Treaty, signed in Washington on 1 December 1959, is an agreement of peace and science. The official text is on the website of the Secretariat of the Antarctic Treaty. This is what it says:

  • Article I: Antarctica shall be used for peaceful purposes only; military bases, maneuvers and weapons tests are prohibited;
  • Article II: scientific research is free;
  • Article III: scientific observations and results shall be exchanged and made freely available;
  • Article V: nuclear explosions and radioactive waste are prohibited;
  • Article VII: observers may go at any time to any area of Antarctica, and “aerial observation may be carried out at any time over any or all areas of Antarctica”.

So the Treaty does not forbid overflights: it expressly provides for them. The official languages of the Treaty are English, French, Russian and Spanish; the quotation is from the English text.

Original document.

Map and sky

Which map does the flat Earth use in the simulator? The Gleason map

The disc is drawn like the map of the Flat Earth Society, the same idea as the Gleason map of 1892: the North Pole at the center and every place at its true distance from the North Pole, along its meridian.

The equator is 10 002 km (6 215 mi) from the center and the edge of the disc 20 003.9 km (12 430 mi). This is why the southern lands, like Australia, South America and Antarctica, are stretched on the disc.

In the simulator the map at the bottom left shows the globe or the disc, zooms in up to 512 times, and with a double click takes you to any point.

How are flights in the southern hemisphere, like Sydney to Santiago, explained?

Qantas flight QF27 flies non-stop from Sydney to Santiago, Chile, in about 12.5 hours, with a Boeing 787 (flight schedule).

On the globe the shortest route between the two airports is 11 363 km (7 061 mi) long: in that time the airplane averages 909 km/h, the normal speed of an airliner.

On the flat Earth map, with the North Pole at the center, Sydney and Santiago lie far apart, on two sides of the disc: the straight line between the two airports is 25 637 km (15 930 mi) long. To cover it in the same time the airplane would have to fly at 2 051 km/h, more than twice as fast.

The two distances come from the same code as the simulator: on the globe along the WGS84 ellipsoid (GeographicLib), on the disc as on the Gleason map. The coordinates are those of the airports of Sydney and Santiago.

What are the Sun and the Moon like on the flat Earth in the simulator?

The Sun and the Moon are in the same direction in which we really see them, at the chosen date and time.

The Flat Earth Society describes a small, nearby Sun that circles above the disc (The Sun): a Sun like that would never set, see the question on the sunset.

So as not to draw a sky that nobody observes, the simulator puts the Sun and the Moon where they are really seen, the same in the two models.

Can the Sun set on the flat Earth?

  1. On the flat Earth of the Flat Earth Society the Sun circles above the disc, a few thousand kilometers high (Distance to the Sun). As it moves away it gets lower, but it cannot go below the horizon: it always stays a few degrees above.
  2. The Sun of the flat Earth is like a street lamp in a huge, flat square: the farther you walk away, the lower you see it, but it never disappears behind the pavement.
  3. The Flat Earth Society explains the sunset with perspective or with light that bends, but it gives no way to calculate when the Sun sets (Sunrise and Sunset).
  4. This is why in the simulator the Sun of the flat Earth is where it is really seen, at that place and at that time: it is the choice most favorable to the flat model.
  5. Even so the sunset does not add up. On the flat Earth the air raises the horizon above the eye line (question on the horizon), so in the evening the Sun disappears behind it before the real sunset, and in the morning it rises later: this is why, in the Pic Gaspard stop, the flat Earth image was taken 17 minutes after the globe one.

Why do the stars in the southern hemisphere turn around another pole? Sigma Octantis

At night the stars turn around a fixed point in the sky. In the northern hemisphere the point is near the North Star; in the southern hemisphere it is the south celestial pole, near the star Sigma Octantis, which you find by following the Southern Cross (Celestial pole, Sigma Octantis).

From Sydney, from Santiago, Chile, and from Cape Town, those who look south see the same pole, with the same stars around it. On the globe this is natural: from the three cities south points toward the same point of the sky, beyond the South Pole. On the flat Earth, with the North Pole at the center, the south of every city points toward the edge of the disc, in three directions far apart: three observers looking in such different directions cannot see the same point of the sky.

The Flat Earth Society wiki proposes two explanations: perspective (Southern Celestial Rotation) or a second pole, with a sky that turns above the south (Bi-Polar Model). The second one is a different model from the single-pole map the simulator uses.

The simulator puts the stars in the direction in which they are really seen, the same in the two models, like the Sun and the Moon: this is why the difference does not show in a single image, but in the comparison between observers in distant cities.

Does the firmament exist, a dome above the flat Earth?

The firmament is the solid vault of the sky of biblical cosmology (Firmament). Some supporters of the flat Earth take it as a real dome above the disc.

No rocket, satellite or balloon has ever met a dome. On 24 October 1946 the V-2 No. 13 rocket, launched from New Mexico, took the first photo of the Earth from space from 105 km (65.2 mi) (V-2 No. 13). The International Space Station circles the Earth at about 400 km (249 mi), 15 and a half times a day, and it has had people on board without interruption since 2 November 2000 (International Space Station).

The simulator rises up to 100 000 m (328 084 ft), where space conventionally begins, and it puts no dome in either of the two models.

The two models

The two models have the same places, at the same latitude and longitude, on two different shapes of the Earth.

North PoleEquator

Spherical Earth (globe)

The globe is the WGS84 reference ellipsoid, slightly flattened at the poles, as satellites and GPS measure it.

Radius at the equator
6 378.1 km3 963 mi
Radius at the poles
6 356.8 km3 950 mi
Flattening
1 / 298.257
Antarctic coast
56 691 km35 226 mi
North PoleEquatorIce

Flat Earth

The flat Earth is the disc of zetetic astronomy and of the Flat Earth Society, drawn like the Gleason map, with the North Pole at the center. Antarctica is a ring of ice around the edge, with the ice wall on the coast; beyond the edge, the void.

Equator from the center
10 002 km6 215 mi
Edge from the center
20 003.9 km12 430 mi
Ice wall (Flat Earth Society)
45.72 m150 ft
Antarctic coast
310 554 km192 969 mi

Sources: WGS84, Gleason map (1892), maps and ice wall of the Flat Earth Society, zetetic astronomy of Rowbotham.

How it was made

The simulator computes the image as a real eye would see it, in the two models, with the same data.

  1. The shape of the Earth

    The globe is the WGS84 ellipsoid. The disc is the one of zetetic astronomy, with the map of the Flat Earth Society, the same as the Gleason map: every place at its true distance from the North Pole.

  2. Mountains and coasts

    Mountains and coasts come from the Copernicus DEM terrain model (ESA): measurements every 30 m (98 ft), or every 90 m (295 ft) where the 30 m (98 ft) ones are not published, used as they are, without corrections; in the simulator they become cells of about 115 m (377 ft). Sea and lakes below zero come from Natural Earth, the distant terrain from ETOPO 2022 (NOAA), the coasts of Antarctica from SCAR. The data are the same in the two models.

  3. The colors of the ground

    The colors do not come from retouched photos: they are the light the ground really reflects, measured by NASA's MODIS satellites (albedo), as an average of five years without seasonal snow; where the finest terrain is, in cells of about 1 km (0.62 mi).

  4. Computed point by point

    For every point of the image the simulator computes what the gaze from the eye meets, with the light bent by the air: sea, land, ice or sky. The mountains are made of small triangles built on the data, in their true place. No perspective tricks.

  5. The air

    The color of the sky and the haze come from the physics of light in air (Rayleigh and Mie), with the values of real air; refraction comes from the 1976 standard atmosphere. Air and refraction are the same in the two models, and they can be turned off.

  6. Sun, Moon and stars

    The simulator computes the positions for the chosen date and time (Astronomy Engine); the stars are those visible to the naked eye from the Bright Star Catalogue; the Moon has the NASA map.

  7. The hot-air balloon

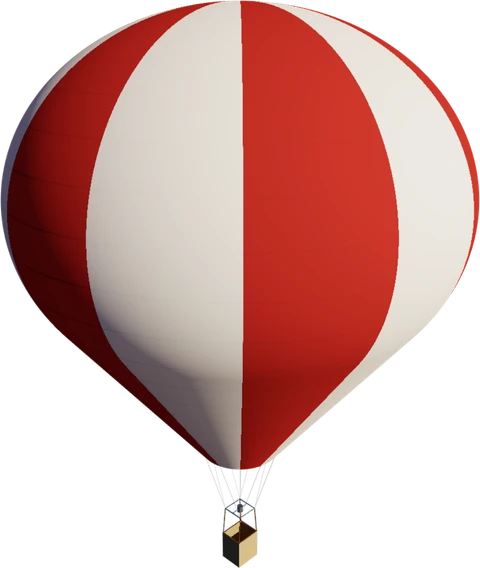
    The simulator uses a one-person hot-air balloon (Cameron O-31) at real scale, with the observer in the basket and the eyes at 1.6 m (5.2 ft). The balloon rises and descends at the speeds of a real hot-air balloon; the simulator lets you rise up to 100 000 m (328 084 ft), well beyond the hot-air balloon record (21 290 m | 69 849 ft).

  8. The measurements

    Dip and distance of the horizon are read on the computed image, as with a protractor: they are not calculated separately.

Data and sources

Here are all the values the simulator uses, with their source, and the sources of the observations cited in the journey. “Project choice” marks a value decided in the project and not taken from a source, for example the starting position.

Spherical Earth

2 values
QuantityValueSource
Radius of the Earth at the equator (semi-major axis)6 378 137 m20 925 646 ftPROJ - Ellipsoids (WGS84) · Moritz H., Geodetic Reference System 1980 (IAG)
Flattening at the poles (inverse)298.257223563PROJ - Ellipsoids (WGS84)

Flat Earth and Antarctica

5 values
QuantityValueSource
Height of the ice wall according to the Flat Earth Society (in the scene the height comes from the terrain)45.72 m150 ftThe Flat Earth Society Wiki - Ice Wall
Edge of the disc: distance from the center (from the North Pole to the South Pole along the meridian)20 003.9 km12 430 miComputed · Karney C. F. F., GeographicLib - JavaScript
Equator on the disc: distance from the center10 002 km6 215 miComputed · Karney C. F. F., GeographicLib - JavaScript
Antarctic coast of the scene on the globe: length56 691 km35 226 miComputed · Gerrish L. et al., High resolution vector polygons of the Antarctic coastline, version 7.12, SCAR Antarctic Digital Database, UK Polar Data Centre, 2026 (CC BY 4.0)
Antarctic coast of the scene on the disc: length310 554 km192 969 miComputed · Gerrish L. et al., High resolution vector polygons of the Antarctic coastline, version 7.12, SCAR Antarctic Digital Database, UK Polar Data Centre, 2026 (CC BY 4.0)

Other sources used

Terrain, coasts and ground

10 values
QuantityValueSource
Simplified Antarctic coast: maximum deviation from the original line25 m82 ftProject choice
Antarctica: south of this latitude-60°The Antarctic Treaty, full text (Secretariat of the Antarctic Treaty, PDF)
Terrain: maximum error in the tiles10 m33 ftProject choice
Terrain: detail on the screen4 pxProject choice
Ground colors: wavelengths of red, green and blue645; 555; 469 nmHogan R. J., A seven-band snow-cleared land-surface albedo/BRDF climatology, version 2.0, ECMWF, 2025 (monthly white-sky albedo 2017-2021 from MODIS MCD43GF v6.1) · Schaaf C., MODIS/Terra+Aqua BRDF/Albedo Gap-Filled Snow-Free Daily L3 Global 30ArcSec CMG V061, NASA EOSDIS Land Processes DAAC, 2024
Ground colors: grid spacing0.025°Hogan R. J., A seven-band snow-cleared land-surface albedo/BRDF climatology, version 2.0, ECMWF, 2025 (monthly white-sky albedo 2017-2021 from MODIS MCD43GF v6.1)
Ground colors where the fine terrain is: grid spacing30 arcsecondsSchaaf C., MODIS/Terra+Aqua BRDF/Albedo Gap-Filled Snow-Free Daily L3 Global 30ArcSec CMG V061, NASA EOSDIS Land Processes DAAC, 2024
Ground colors: maximum error (levels out of 255)1Project choice
Antarctic snow: reflected light0.97Grenfell T. C., Warren S. G., Mullen P. C., Reflection of solar radiation by the Antarctic snow surface at ultraviolet, visible, and near-infrared wavelengths, JGR 99(D9), 1994
Terrain shadows: the ray toward the Sun starts at this height above the ground2 m6.6 ftProject choice

Sea

21 values
QuantityValueSource
Sea: diffuse reflected light0.06Payne R. E., Albedo of the Sea Surface, Journal of the Atmospheric Sciences 29(5), 1972
Water: refractive index1.333Hale G. M., Querry M. R., Optical constants of water in the 200-nm to 200-µm wavelength region, Applied Optics 12(3), 1973
Waves: slope without wind (Cox and Munk)0.003Cox C., Munk W., Measurement of the Roughness of the Sea Surface from Photographs of the Sun’s Glitter, JOSA 44(11), 1954
Waves: slope for each m/s of wind (Cox and Munk)0.00512 s/mCox C., Munk W., Measurement of the Roughness of the Sea Surface from Photographs of the Sun’s Glitter, JOSA 44(11), 1954
Wind for the light on the waves5 m/sProject choice
Drawn waves: direction the wind comes from315°Project choice
Drawn waves: number16Project choice
Drawn waves: the longest40 m131 ftProject choice
Drawn waves: the shortest0.3 m0.98 ftProject choice
Drawn waves: spread of the directions around the wind75°Project choice
Drawn waves: share of the sea slope0.8Project choice
Drawn waves: shape of the crests, from long to short waves0.3; 0.9Project choice
Drawn waves: bend of the crests0.55Project choice
Drawn waves: variation of the height0.8Project choice
Drawn waves: nearby waves with the same bend and the same height4Project choice
Drawn waves: width of the bend and height zones, in wavelengths1.2; 3Project choice
Drawn waves: drift of the bend (east, north)0.05; 0.03 1/sProject choice
Drawn waves: drift of the height variation (east, north)0.11; 0.07 1/sProject choice
Drawn waves: light of the dark faces, never below this share of the average0.35Project choice
Drawn waves: ripples smaller than a pixel that always remain0.35Project choice
Drawn waves: pixels per wave (disappears, whole)4; 12 pxProject choice

Air and refraction

24 values
QuantityValueSource
Standard atmosphere: altitude of each layer and temperature change(0 m | 0 ft; -0.0065 K/m); (11 000 m | 36 089 ft; 0 K/m); (20 000 m | 65 617 ft; 0.001 K/m); (32 000 m | 104 987 ft; 0.0028 K/m); (47 000 m | 154 199 ft; 0 K/m); (51 000 m | 167 323 ft; -0.0028 K/m); (71 000 m | 232 940 ft; -0.002 K/m); (84 852 m | 278 386 ft; 0 K/m)NOAA, NASA, USAF, U.S. Standard Atmosphere, 1976 (NOAA-S/T 76-1562, NASA-TM-X-74335)
Temperature at sea level288.15 KNOAA, NASA, USAF, U.S. Standard Atmosphere, 1976 (NOAA-S/T 76-1562, NASA-TM-X-74335) · Ciddor P. E., Refractive index of air: new equations for the visible and near infrared, Applied Optics 35(9), 1996
Pressure at sea level101 325 PaNOAA, NASA, USAF, U.S. Standard Atmosphere, 1976 (NOAA-S/T 76-1562, NASA-TM-X-74335) · Ciddor P. E., Refractive index of air: new equations for the visible and near infrared, Applied Optics 35(9), 1996
Standard acceleration of gravity9.80665 m/s²NOAA, NASA, USAF, U.S. Standard Atmosphere, 1976 (NOAA-S/T 76-1562, NASA-TM-X-74335)
Molar mass of air0.0289644 kg/molNOAA, NASA, USAF, U.S. Standard Atmosphere, 1976 (NOAA-S/T 76-1562, NASA-TM-X-74335)
Gas constant8.31432 J/(mol K)NOAA, NASA, USAF, U.S. Standard Atmosphere, 1976 (NOAA-S/T 76-1562, NASA-TM-X-74335)
Radius for the altitudes of the standard atmosphere6 356 766 m20 855 531 ftNOAA, NASA, USAF, U.S. Standard Atmosphere, 1976 (NOAA-S/T 76-1562, NASA-TM-X-74335)
Air index: dispersion coefficients (Ciddor)238.0185; 5 792 105; 57.362; 167 917 µm⁻²Ciddor P. E., Refractive index of air: new equations for the visible and near infrared, Applied Optics 35(9), 1996
Air index: carbon dioxide correction (Ciddor)5.34 × 10⁻⁷ mol/µmolCiddor P. E., Refractive index of air: new equations for the visible and near infrared, Applied Optics 35(9), 1996
Air index: reference carbon dioxide (Ciddor)450 µmol/molCiddor P. E., Refractive index of air: new equations for the visible and near infrared, Applied Optics 35(9), 1996
Air index: compressibility (Ciddor)1.58123 × 10⁻⁶ K/Pa; -2.9331 × 10⁻⁸ 1/Pa; 1.1043 × 10⁻¹⁰ 1/(K Pa); 1.83 × 10⁻¹¹ K²/Pa²Ciddor P. E., Refractive index of air: new equations for the visible and near infrared, Applied Optics 35(9), 1996
Carbon dioxide in the air450 µmol/molProject choice
Refraction: wavelength of the light0.55 µmProject choice
End of the simulated air100 000 m328 084 ftProject choice
Sky: scattering of light in clean air, for red, green and blue (Rayleigh)5.135 × 10⁻⁶; 1.2159 × 10⁻⁵; 3.0345 × 10⁻⁵ 1/mHansen J. E., Travis L. D., Light scattering in planetary atmospheres, Space Science Reviews 16, 527-610, 1974 (Rayleigh optical depth)
Sky: altitude at which clean air thins out8 000 m26 247 ftBruneton E., Precomputed Atmospheric Scattering, reference implementation 2017 (demo.cc)
Haze: light removed per meter (Mie)4.44 × 10⁻⁶ 1/mBruneton E., Precomputed Atmospheric Scattering, reference implementation 2017 (demo.cc)
Haze: share of the light scattered and not absorbed0.9Bruneton E., Precomputed Atmospheric Scattering, reference implementation 2017 (demo.cc)
Haze: altitude at which it thins out1 200 m3 937 ftBruneton E., Precomputed Atmospheric Scattering, reference implementation 2017 (demo.cc)
Haze: how much it scatters forward0.8Bruneton E., Precomputed Atmospheric Scattering, reference implementation 2017 (demo.cc)
Ozone: absorbed light, for red, green and blue6.5 × 10⁻⁷; 1.881 × 10⁻⁶; 8.5 × 10⁻⁸ 1/mHillaire S., A Scalable and Production Ready Sky and Atmosphere Rendering Technique, Computer Graphics Forum 39(4), 2020
Ozone: altitude of the layer25 000 m82 021 ftBruneton E., Precomputed Atmospheric Scattering, reference implementation 2017 (demo.cc)
Ozone: half the thickness of the layer15 000 m49 213 ftBruneton E., Precomputed Atmospheric Scattering, reference implementation 2017 (demo.cc)
Visibility of the air: smallest contrast the eye can distinguish0.02Wikipedia, Visibility (Koschmieder equation, 2% contrast)

Sun, Moon and stars

26 values
QuantityValueSource
Sun: apparent radius0.004675 radBruneton E., Precomputed Atmospheric Scattering, reference implementation 2017 (demo.cc)
Sun: radius695 700 000 m2 282 480 315 ftIAU 2015 Resolution B3, nominal solar radius
Mean distance between the Earth and the Sun (astronomical unit)1.49598 × 10¹¹ mIAU 2012 Resolution B2, astronomical unit (Paris Observatory)
Sun: brightness outside the air (magnitude)-26.76 magWillmer C. N. A., The Absolute Magnitude of the Sun in Several Filters, The Astrophysical Journal Supplement Series 236(2), 2018
Date and time of the Sun at openingNovember 26, 2026 at 8:00 AM UTCProject choice
Glare: age of the observer23 yearsSpieringhs R. M. et al., Road marking contrast threshold for the elderly and the impact of glare, KU Leuven
Glare: coefficients10; 5; 62.5CIE 146:2002, CIE equations for disability glare · Spieringhs R. M. et al., Road marking contrast threshold for the elderly and the impact of glare, KU Leuven
Glare: smallest angle of the formula0.1°CIE 146:2002, CIE equations for disability glare · Spieringhs R. M. et al., Road marking contrast threshold for the elderly and the impact of glare, KU Leuven
Stars: all those brighter than magnitude6.5 magHoffleit D., Warren W. H. Jr., The Bright Star Catalogue, 5th Revised Ed. (Preliminary Version), 1991 (CDS V/50, NASA HEASARC BSC5P)
Stars: light of a magnitude 0 star2.54 × 10⁻⁶ lxCrumey A., Human contrast threshold and astronomical visibility, Monthly Notices of the Royal Astronomical Society 442(3), 2014
Eye: threshold for seeing a point of light (coefficients)5.949 × 10⁻⁸; -2.389 × 10⁻⁷; 2.459 × 10⁻⁷; 4.12 × 10⁻⁴; -4.225 × 10⁻⁴ lxCrumey A., Human contrast threshold and astronomical visibility, Monthly Notices of the Royal Astronomical Society 442(3), 2014 · Blackwell H. R., Contrast Thresholds of the Human Eye, Journal of the Optical Society of America 36(11), 1946
Eye: factor for observing outdoors2Project choice
Darkest night sky: luminance1.71 × 10⁻⁴ cd/m²Crumey A., Human contrast threshold and astronomical visibility, Monthly Notices of the Royal Astronomical Society 442(3), 2014
Stars: minimum brightness drawn0.3Project choice
Stars: magnitudes up to full white3 magProject choice
Moon: radius1 737 400 m5 700 131 ftNASA Goddard Space Flight Center, Moon Fact Sheet
Moon: reflected light (geometric albedo)0.12NASA Goddard Space Flight Center, Moon Fact Sheet
Moon: light toward the edge (McEwen)1; -0.019 1/°; 2.42 × 10⁻⁴ 1/°²; -1.46 × 10⁻⁶ 1/°³McEwen A. S., A precise lunar photometric function, Lunar and Planetary Science XXVII, 1996 (coefficients as cited in LPSC XLV, 2014, abstract 1679)
Moon: brightness according to the phase0.026 mag/°; 4 × 10⁻⁹ mag/°⁴Krisciunas K., Schaefer B. E., A model of the brightness of moonlight, PASP 103, 1991
Moon at night: exposure of the dark-adapted eye1Project choice
Moon: contrast for the adaptation of the eye2; 50Project choice
Moon halo: cells per side that gather the light of the disc8Project choice
Moon halo: beyond this angle it is computed from the center of the light3°Project choice
End of civil twilight: altitude of the Sun-6°U.S. Naval Observatory, Rise, Set, and Twilight Definitions
End of nautical twilight: altitude of the Sun-12°U.S. Naval Observatory, Rise, Set, and Twilight Definitions
End of astronomical twilight: altitude of the Sun-18°U.S. Naval Observatory, Rise, Set, and Twilight Definitions

Hot-air balloon and flight

33 values
QuantityValueSource
Hot-air balloon altitude record (2005)21 290 m69 849 ftHot air ballooning - altitude record (Vijaypat Singhania, 2005)
Altitude record of a person with a balloon (2014)41 419 m135 889 ftStratEx Space Dive (Alan Eustace, 24 October 2014, 41 419 m)
Hot-air balloon: maximum ascent speed3 m/sUltramagic - Flight Manual Supplement 34 (N-500 envelope)
Hot-air balloon: maximum descent speed4 m/sUltramagic - Flight Manual Supplement 34 (N-500 envelope)
“Go to altitude”: duration of the move2 sProject choice
Maximum altitude of the simulator (Kármán line)100 000 m328 084 ftProject choice
Time acceleration at opening1 000Project choice
Cameron O-31 hot-air balloon: maximum takeoff mass285 kgUK CAA - Type-Certificate Data Sheet UK.TC.BA.00002, Cameron Hot-Air Balloons, Issue 5 (2025)
Envelope: height from the mouth to the top12.9 m42.3 ftKubicek Balloons - BB9EF hopper envelope (900 m3, 12 gores, diameter 12.3 m, height from mouth to top 12.9 m) · Cameron Balloons (USA) - O-Type envelopes (volume, gores, height and diameter in feet, O-42 to O-160)
Envelope: diameter12.4 m40.7 ftCameron Balloons - O-Type envelopes (volume, gores, height and width)
Envelope: volume890 m³Cameron Balloons - O-Type envelopes (volume, gores, height and width)
Envelope: gores12Cameron Balloons - O-Type envelopes (volume, gores, height and width) · UK CAA - Type-Certificate Data Sheet UK.TC.BA.00002, Cameron Hot-Air Balloons, Issue 5 (2025)
Load cables12UK CAA - Type-Certificate Data Sheet UK.TC.BA.00002, Cameron Hot-Air Balloons, Issue 5 (2025)
Envelope mouth: diameter2.5 m8.2 ftProject choice
Envelope mouth above the burner frame2.5 m8.2 ftProject choice
Basket: outside dimensions0.8; 0.9 m3 ftCameron Balloons - Flight Manual Section 8.73, Lindstrand Technologies Bottom Ends (baskets and burner frames)
Basket: wall height1.05 m3.44 ftProject choice
Eyes of the observer from the basket wall0.15 m0.49 ftProject choice
Basket: wall thickness0.04 m0.13 ftProject choice
Burner frame: side0.7 m2.3 ftCameron Balloons - Flight Manual Section 8.73, Lindstrand Technologies Bottom Ends (baskets and burner frames)
Burner frame above the basket rim1 m3.3 ftProject choice
Burner frame: tube diameter0.03 m0.098 ftProject choice
Burner: diameter and height0.18; 0.22 m0.72 ftProject choice
Frame rods: diameter0.03 m0.098 ftProject choice
Cables: diameter0.005 m0.016 ftProject choice
Fabric: light that passes through it0.2Project choice
Envelope: panel height1 m3.3 ftProject choice
Envelope: tape width0.025 m0.082 ftProject choice
Envelope: colors of the gores(0.32; 0.035; 0.03); (0.75; 0.73; 0.68)Project choice
Basket: color of the wicker0.42; 0.3; 0.16Project choice
Basket: color of the leather trim0.12; 0.07; 0.04Project choice
Steel: reflected light0.56; 0.57; 0.58Hoffman N., Physics and Math of Shading, SIGGRAPH 2015 Physically Based Shading course (metal F0 table: iron)
Steel: roughness0.35Project choice

Observer, camera and map

16 values
QuantityValueSource
Eye height of a standing person1.6 m5.2 ftANSUR - Anthropometric Summary Data Tables (eye height, standing), NC State Ergonomics Center, archived copy
Field of view before the window is known60°Lynch D. K., Visually discerning the curvature of the Earth, Applied Optics 47(34), 2008
Reference pixel: pixels per inch and eye distance in inches96 px/in; 28 inW3C, CSS Values and Units Module Level 4, 6.2 Absolute Lengths (reference pixel)
Natural field of view: minimum20°Project choice
Field of view: minimum10°Project choice
Field of view: maximum120°Project choice
Camera: exposure5Project choice
Screen: curve from light to color (ACES)2.51; 0.03; 2.43; 0.59; 0.14Narkowicz K., ACES Filmic Tone Mapping Curve, 2016
Screen: color encoding (sRGB)0.04045; 12.92; 0.055; 2.4IEC 61966-2-1:1999, Default RGB colour space - sRGB
Brightness of a color: weight of red, green and blue0.2126; 0.7152; 0.0722ITU-R BT.709-6, Parameter values for the HDTV standards
Maximum pixels computed per image2 073 600 pxProject choice
Share of the pixels computed while the view moves (less only on slow computers, then all again)1Project choice
Minimum share of the pixels in motion, on slow computers0.0625Project choice
In motion: slow image, the pixels are halved33 msProject choice
In motion: fast image, doubling them is tried again12 msProject choice
Map: maximum zoom512Project choice

Places and observations of the journey

5 values
QuantityValueSource
Sydney Airport: latitude-33.94611°Wikipedia, Sydney Airport (SYD): coordinates
Sydney Airport: longitude151.17722°Wikipedia, Sydney Airport (SYD): coordinates
Santiago, Chile, airport: latitude-33.39278°Wikipedia, Arturo Merino Benitez International Airport (SCL): coordinates
Santiago, Chile, airport: longitude-70.78556°Wikipedia, Arturo Merino Benitez International Airport (SCL): coordinates
Qantas flight QF27 Sydney-Santiago: duration750 minFlightmapper, Qantas flight QF 27: Sydney - Santiago (non-stop, Boeing 787-9, 12:30 scheduled)

Ready-made positions

32 values
QuantityValueSource
Start, Ostia (Lido Centro station): latitude41.7332534°Project choice
Start, Ostia: longitude12.2843045°Project choice
Start: direction of the gaze308°Project choice
Only for the tests: gaze relative to the Sun25°Project choice
Tyrrhenian Sea off Ostia: latitude41.7°Project choice
Tyrrhenian Sea off Ostia: longitude12.1°Project choice
Turin, Piazza Castello: latitude45.071161°Project choice
Turin, Piazza Castello: longitude7.685957°Project choice
New York, City Hall Park: latitude40.7128679°Project choice
New York, City Hall Park: longitude-74.0058698°Project choice
Honolulu, Kapiolani Park: latitude21.2653527°Project choice
Honolulu, Kapiolani Park: longitude-157.8191592°Project choice
Mumbai, Gateway of India: latitude18.9219661°Project choice
Mumbai, Gateway of India: longitude72.8345657°Project choice
Sydney, Bondi Pavilion: latitude-33.8901046°Project choice
Sydney, Bondi Pavilion: longitude151.2775798°Project choice
Front of the Ross Ice Shelf: latitude-77.714°Project choice
Front of the Ross Ice Shelf: longitude180°Project choice
Edge of the disc (on the globe near the South Pole): latitude-89.99°Project choice
Edge of the disc: longitude180°Project choice
Livorno, shore south of the port: latitude43.54°Project choice
Livorno, shore south of the port: longitude10.299°Project choice
Anchorage, Point Woronzof: latitude61.2042°Alaska.org, Mt. Denali viewpoints (Anchorage, Point Woronzof)
Anchorage, Point Woronzof: longitude-150.0187°Alaska.org, Mt. Denali viewpoints (Anchorage, Point Woronzof)
Pic de Finestrelles, summit: latitude42.41445°Wikipedia, Pic Gaspard: photo by Marc Bret from Pic de Finestrelles (443 km), 16 July 2016
Pic de Finestrelles, summit: longitude2.13353°Wikipedia, Pic Gaspard: photo by Marc Bret from Pic de Finestrelles (443 km), 16 July 2016
Everest, summit: latitude27.98817°Project choice
Everest, summit: longitude86.92502°Project choice
North Pacific: latitude35°Project choice
North Pacific: longitude-150°Project choice
Roswell, New Mexico: latitude33.3°Project choice
Roswell, New Mexico: longitude-104.53°Project choice

What is not simulated

Every representation simplifies something. These are the simplifications of the simulator, the same in the two models except where stated.

  • Wind and currents: the balloon rises and descends vertically.
  • Burner, envelope temperature and inertia: the vertical speed is the one set by the lever, within the real limits of a hot-air balloon.
  • Geoid: sea level is the ellipsoid, without the geoid undulations of a few tens of meters.
  • Clouds and weather: the sky is always clear, with the haze of the standard atmosphere; there are no clouds, fog or rain.
  • Mountains: the smallest cell is about 115 m (377 ft); buildings, trees and smaller objects are not there. From afar the simulator uses larger cells, about one every four pixels.
  • City lights: at night the land is dark, without lights turned on by people.
  • Very steep spires (Matterhorn, Monviso, Fitz Roy): the satellite radar does not see them whole, so they are lower and rounder, from about 100 m (328 ft) to over 500 m (1 640 ft) below the official height.
  • Ground colors: average of five years without seasonal snow, in cells of about 1 km (0.62 mi) where the finest terrain is and of 2.8 km (1.7 mi) elsewhere: up close the color changes in wide patches.
  • Waters: below zero, only what is connected to the sea or to a Natural Earth lake is water; some lakes with a bed below sea level are shown as water at zero altitude.
  • Fine terrain unavailable (while loading or at the daily limit of the service): the simulator uses the 60" terrain, which keeps the height of the peaks but draws the nearby hills wider.
  • Refraction: it is the one of the standard atmosphere, the same every day; the days with cold air near the ground, when you see farther than usual, are not represented.
  • Waves: they are drawn in the light of the sea, not in the shape of the surface.
  • Color of the sea: it is only the reflected light of the sky and the Sun; the light that enters the water and comes back out, which gives the sea its blue or its green, is not there.
  • Balloon on the water: the basket rests on the surface, without floating and without moving with the waves.
  • Accelerated time: it changes the speed of the climb, not the date and time of the Sun, which the user chooses.
  • Stars: those visible to the naked eye are there; the fainter ones, visible only with binoculars or a telescope, are not.
  • Sun and Moon on the flat Earth: in the observed direction, not as objects above the disc. The sources of the flat theory give the size and height of the Sun, but none documents how to calculate sunset and sunrise, so they could not be applied.
  • Perspective: the flat theory invokes it for sunset and horizon, but none of its sources documents how to calculate it (no formula); the simulator uses the same optics in the two models.

How to use it

Drag the scene to look around. The lever on the right makes the balloon rise and descend; the altitude button takes it to an exact altitude in 2 seconds. With a double click on the scene or on the map you choose a point and, confirming with “Go”, you get there. The house icon, at the top right, takes you back to the home page; “Copy scene link” copies an address that reopens the same view. Every icon has a tooltip with its name and key.

WS↑↓
Look up and down
AD←→
Turn left and right
PL
Rise and descend
G
Go to altitude
T
Globe or flat Earth
X
Look straight
C
Look at the horizon
O
Follow the horizon
V
Field of view
F
Natural field of view
K
Atmosphere
J
Refraction
E
Eye line
Z
Horizon line
M
Map
N
Position
U
Sun date and time
I
Flight instruments
B
Hot-air balloon
+−1
Faster, slower, normal time (1)
0
Reset

Reports

If you want to report an error or a problem, write it here. If it is about a scene of the simulator, add its link: in the simulator the “Copy scene link” button copies it.

How we handle reports: privacy policy.

Support the project

Flat or Globe? is free and has no ads. Donations cover the costs of the services that keep it online, including the terrain of the whole world. If you find it useful, you can support it with a donation of any amount.

Donate with PayPal

The PayPal page opens: this site does not receive your payment details.

You have traveled around the world. Now you choose the place.

Enter the simulator, double-click any point of the Earth and go there: rise up to 100 000 m (328 084 ft), switch from the globe to the flat Earth and measure the horizon yourself.

Enter the simulator